Join War on the Rocks and gain access to content trusted by policymakers, military leaders, and strategic thinkers worldwide.

American political and military leaders are amplifying flawed estimates that China’s annual defense spending is much higher than it actually is. In these mistaken calculations, China’s defense spending has reached $700 billion, approaching the level of the U.S. defense budget. These exaggerated estimates have gained traction in Congress, the media, and defense circles.
However, as we show in our recent article in the Texas National Security Review (and as we also discussed on Horns of a Dilemma) these exaggerated estimates count spending categories for China without counting similar spending for the United States and apply purchasing power parity methods emphasizing low labor costs as a key military advantage. PPP exchange rate estimates address a problem familiar to many international travelers: a dollar spent in a poorer country will buy more of a domestic product like clothing, food, or housing than a dollar spent in a richer country. Higher overall price levels in richer countries are due to higher levels of technology investment, productivity, and wages. Purchasing power parity adjusts for different price levels to allow cost comparison for similar products.
Accounting for spending not included in official budgets and using new World Bank purchasing power parity data published in 2024, we estimate that China will spend the equivalent of $474 billion on defense in 2024, much more than its official 2024 defense budget of $232 billion at market exchange rates. When compared to similar U.S. spending categories, this represents 36 percent of 2024 U.S. defense-related spending of $1.3 trillion.
Our approach is based on two simple but frequently ignored principles. First, any comparison to U.S. defense spending should contain similar spending categories for China and for the United States. Second, the exchange rate employed for converting currencies should be appropriate to the military budget. If purchasing power parity adjustments are made for specific budget elements such as military wages, then they should, where possible, be based on actual cost data (not estimates). Where this is more difficult, appropriate sector-level purchasing power parity data should be applied to inputs such as personnel, operations and training, and equipment costs.
Why do such estimates matter, and why is it important to make them as accurately as possible? First, there is no excuse for getting an important national security–related estimate wrong when better data and methods are available. Second, defense spending estimates play a critical role in assessing the degree and nature of military challenges that China poses to the United States and its allies. All else equal, a larger defense budget suggests a more salient threat. Underestimating the threat can leave one unprepared, while overestimating it can fuel spirals of security competition. Third, a misplaced focus on aggregate spending levels can distract attention from the more important debate about what kinds of capabilities the United States should purchase in response to China’s ongoing military modernization.
Creating a Military Purchasing Power Parity
There are a number of reasonable ways to compare U.S. and Chinese defense spending, but no analytically defensible approach would produce a number that shows China rapidly catching up to or on the cusp of surpassing U.S. total comparable defense spending, as the $700 billion estimate is purported to show. Among the problems with estimates that produce such high figures is the inclusion of spending categories beyond the official defense budget for China without including the same categories of defense-related spending for the United States, such as domestic security, benefits to veterans, defense-related research and development not in the official defense budget, and “civil-military fusion” (the fusing of commercial and defense-related spending on technologies such as semiconductors and artificial intelligence).
Additional errors come with the use of purchasing power parity exchange rates. Importantly, purchasing power estimates have limitations. For example, they were not developed to measure internationally tradable goods, services, and technologies. Instead, market exchange rates better reflect purchasing power for these goods.
Using the market exchange rate to convert Chinese defense spending to equivalent dollars may be the best choice because it more accurately reflects the cost of advanced weapons and equipment, and it is less prone to calculation error. However, market exchange rates can understate purchasing power for some types of defense spending in a country like China. In a developing economy, wages, clothing, food, and construction will be based on labor-intensive costs. If purchasing power parity is used, however, careful consideration must be given to how the adjustments relate to real-world inputs and outputs. Purchasing power adjustments in labor-intensive sectors will show a significant purchasing power advantage for China.
However, purchasing power parity exchange rates can also reflect lower relative purchasing power than market exchange rates for capital- and technology-intensive goods. World Bank figures show that China’s purchasing power for machinery and equipment technology is significantly less than the purchasing power implied by the market exchange rate. In other words, certain technologies are more costly for China to acquire than they would be for the United States to acquire. This can occur where there are trade barriers for such goods, or where the cost of barriers to entry or learning curves must be overcome. Any purchasing power parity exchange rate used should correspond — within reasonable bounds — to the spending category under consideration. The World Bank’s methodological guidelines and methods should be followed to ensure that the defense-related goods under consideration are comparable.
Some estimates of Chinese defense spending use a single economy-wide purchasing power parity exchange rate to inflate China’s entire defense budget or apply that general adjustment inappropriately to parts of the budget. This is misleading because any defense budget includes a mix of domestic labor-intensive components on one hand, and internationally traded or capital-intensive components on the other.
Many of the recent high estimates for Chinese defense spending commit a different error: They apply specialized purchasing power exchange rates for the cost of (less skilled) labor to broad components of China’s defense spending without applying the appropriate specialized exchange rates for other spending categories. This presents an inflated and unbalanced picture of China’s defense purchasing power. Compounding the error, some sources attempt to estimate defense sector wages through proxy variables. These estimates do not fully account for differences in productivity (effectiveness) between Chinese and American military personnel and defense sector labor. Moreover, the wage estimates themselves do not benchmark well to actual data for Chinese military personnel. Some Chinese military wage data indicate that recent econometric estimates of defense labor costs inflate China’s defense labor purchasing power by more than 100 percent.
The good news is that purchasing power data that corresponds to the various categories of defense spending is available. The World Bank produces purchasing power parity exchange rates that estimate price levels for the entire economy (gross domestic product), and also for specific sectors such as consumption, construction, and technology such as equipment and machinery. This data is collected in detailed field surveys of actual prices by the International Comparison Program. The data is not updated frequently. The most recent field survey was conducted in 2021 and published in June 2024. Previous surveys were conducted in 2005, 2011, and 2017. However, these data series have significant advantages: They are based on actual prices for products and services, have a consistent methodology and basis for comparison of products, and reveal some changes over time.
To create a balanced and accurate “military purchasing power parity,” we use World Bank data to account for defense spending categories including personnel, operations and training, and equipment. We use specific, appropriate purchasing power exchange rates for overall gross domestic product, wages, consumption, construction, and equipment for each respective category of defense spending.
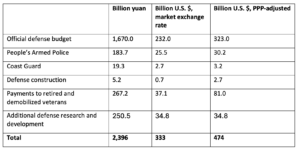
In June 2024 (soon after our article in the Texas National Security Review was published), the World Bank released new data from field surveys conducted in 2021, and made minor revisions to its earlier 2017 data set. Table 1 shows our updated estimate for 2024 Chinese defense spending using the newest data. The new data results in a slight (0.6 percent) increase in our estimate of China’s 2024 defense spending, to the equivalent of $474 billion. There is more than one way to tackle the problem of creating a balanced and more accurate military purchasing power parity, so to encourage debate and improvements, we explain our approach in the online appendix.
Table 1. China’s Estimated 2024 Defense Spending, using new purchasing power parity (PPP) exchange rates published in June 2024
Nuclear weapons, space, and intelligence programs not included
Common Sense Test for Purchasing Power Parity Conversion
Recent analyses of Chinese defense spending that employ economy-wide purchasing power parity multipliers or specialized labor cost estimates fail the common-sense test. The most lethal modern military capabilities are based on technology-intensive weapons and systems, where sector-level price data indicate that China has lower — not higher— purchasing power than the market exchange rate. The labor-intensive factors such as low personnel or basic materiel costs where China enjoys purchasing power advantages are among the least lethal military capabilities, such as light infantry.
Assessments that inflate the least lethal capabilities the most turn the logic of modern military power on its head. They argue that China’s relatively lower wage and price levels — due to its relatively lower level of economic and technological development — are a military advantage rather than a disadvantage. However, any future conflict between China and the United States is more likely to be determined by the relative strength of advanced air, sea, and space capabilities (and the ability of operators to employ those capabilities effectively and flexibly), rather than the number of infantry soldiers. Chinese military systems meant to compete with American capabilities, such as fifth-generation fighter aircraft, cutting-edge submarines, or precision-guided weapons, will be based at least in part on globally sourced technology that is costly to acquire, or on costly indigenous development and substitution for globally sourced technologies — costs that low wages cannot offset.
Although purchasing power adjustments can help with insights on the overall size of an economy and relative domestic living standards across countries, using them to adjust specific government budgets or spending items is complex. Methodological errors and biases can heavily affect final outcomes.
A purchasing power parity adjustment for wages simply shows that China has a relative advantage in labor costs for military personnel. But China only derives benefits from cheaper wages relative to the capabilities those wages can purchase. Benefits from labor are only proportional to costs if — and only if — one assumes that U.S. and Chinese ground forces, naval, air, space and other highly specialized military personnel are functional equivalents. Yet there are many reasons to believe that U.S. and Chinese military personnel are not functionally equivalent based on differences in education, training, and service experience. Reflecting such differences, U.S. labor productivity is roughly seven times higher than China’s at market exchange rates, and about four times higher when adjusted for purchasing power parity.
Although we may not expect a gap that large in military productivity or effectiveness, assuming that a Chinese officer or noncommissioned officer fulfills the same functions at the same level of effectiveness as a U.S. counterpart is questionable. The difference at the junior enlisted level is equally large because junior enlisted in the U.S. system are volunteers typically being cultivated as the next generation of enlisted leaders or for promotion to the officer corps, whereas Chinese junior enlisted personnel are typically conscripts who serve shorter terms and receive lower quality training. Moreover, even if one assumes that China possesses a proportional advantage in labor-intensive sectors, this means only that China has a purchasing power advantage for labor-intensive goods. These are the least lethal capabilities. China does not have a purchasing power advantage for high-technology goods, which underpin the most lethal capabilities. China’s military reforms have progressively shifted the People’s Liberation Army toward an emphasis on high technology and away from labor-intensive forces, i.e., away from those areas that receive the largest benefit from inflationary purchasing power parity adjustments.

What Do the New Figures Tell Us?
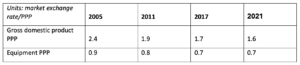
The new data indicate that China’s overall purchasing power relative to the market exchange rate did not change much since 2017. At the highest level and compared to same-year market exchange rates, China’s economy-wide purchasing power was 1.6 times that implied by the market exchange rate in 2021, down slightly from 2017 (table 3). Sector-level data show that China’s relative purchasing power increased in areas such as housing, health care, construction, transportation, and communications. However, since 2017, China’s relative purchasing power eroded in sectors such as total consumption, education, and the technology embodied in machinery and equipment.
For example, the most recent World Bank data show that China’s purchasing power exchange rate for machinery and equipment is 9.9 yuan per dollar. Unlike the overall gross domestic product purchasing power parity of 3.99 yuan per dollar, this implies China’s purchasing power for some capital-intensive goods is less than indicated by the 2021 market exchange rate of 6.45 yuan per dollar. In other words, in some equipment sectors, China needs to spend more than the market exchange rate suggests to purchase an equivalent product. These adjustments reflect a relative purchasing power disadvantage for China in these technology sectors, not an advantage. This has been a consistent result in all World Bank price surveys of China since their inception in 2005 (table 2).
Table 2. China Market Exchange Rates and PPP Exchange Rates
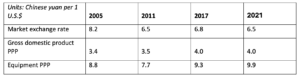
Table 3. China’s Indicative “Purchasing Power” Relative to the Market Exchange Rate
Since 2012, Beijing’s reversal of economic reforms, the recentralization of economic decision-making, and the resurgence of state intervention in the economy have added to China’s persistent problems with technological innovation and dependence on imported technology and components. The new purchasing power parity data indicate that in some equipment and technology sectors, China’s domestic costs are higher than the market exchange rate implies, and this disadvantage worsened between 2017 and 2021. Competition for higher technology military, naval, and aerospace power able to compete with that of the United States and its allies such as Japan will remain tough and costly for China. At a minimum, China enjoys no purchasing power advantage in military technology and equipment. Even in military areas where China has invested heavily in research and development, it still depends on imported technology, which can only be purchased at market exchange rates (and access can be interrupted or made even more costly by sanctions).
Military Balance and U.S Choices
Accurate assessment of China’s defense spending matters for several reasons. First, it informs how the United States should spend its scarce resources to strengthen its position relative to China. For example, should the U.S. Air Force retire older airframes and spend the savings to rejuvenate the force? Or should it continue to maintain them to maximize current, rather than future, capability? Second, accurate assessment helps U.S. leaders balance competing priorities in the face of multiple global security challenges, such as Russia’s invasion of Ukraine and the war between Israel and its foes. Third, inaccurate assessments could lead to unwanted outcomes. For example, significantly overestimating China’s defense spending could create strong pressure for the United States to overreact, further exacerbating tensions between the two countries. Alternatively, overestimates might strengthen the hand of those who believe the risks and costs of maintaining U.S. regional alliances or the U.S. strategic position in Asia are too high. Finally, inaccurate assessments could undermine deterrence by creating uncertainty about the relative balance of power. Large gaps in spending, power, and capability remain, and it is better for policymakers in both the United States and China to know it.
Understanding military spending in China and the United States is only one piece of a set of analytic challenges that must be tackled in order to make better strategic and military policy. If policymakers and the media view budget analysis as an important metric, however, the analysis should be done thoughtfully and reasonably. Legislation on assessments of Chinese defense spending now under consideration in Congress should compare like-for-like spending categories, use market exchange rates to convert Chinese spending or, if purchasing power parity is used, apply balanced and appropriate exchange rates for each category of Chinese defense spending. Reporting on China’s overall defense spending should appear alongside assessment of the material capabilities China is acquiring.
Taylor Fravel is the Arthur and Ruth Sloan professor of political science and director of the Security Studies Program at the Massachusetts Institute of Technology (MIT).
George J. Gilboy is an executive at a global energy firm and a research affiliate at the MIT Center for International Studies.
Eric Heginbotham is a principal research scientist at the MIT Center for International Studies and is co-director of the wargaming lab at the MIT Security Studies Program.
Image: Chairman of the Joint Chiefs of Staff via Wikimedia Commons