
Editor’s note: We’ve partnered with the National Consortium for the Study of Terrorism and Responses to Terrorism (START) to publish a series of infographics based on data from their Global Terrorism Database and related START projects. Each week we’ll release a new set of graphics that depict trends in global terrorism activity. Sign up for the War on the Rocks newsletter to make sure you don’t miss any of them!
Terrorism’s footprint is truly global. In 2013, according to data collected by START, incidents of terrorism were recorded in 94 countries around the world. But the threat is far from uniform. The map below depicts the intensity and concentration of terrorist violence in 2013. We’ll follow up on this global picture with new infographic sets each week that examine some of the most interesting current and historical trends in terrorist activity. (Click on the image to expand it).
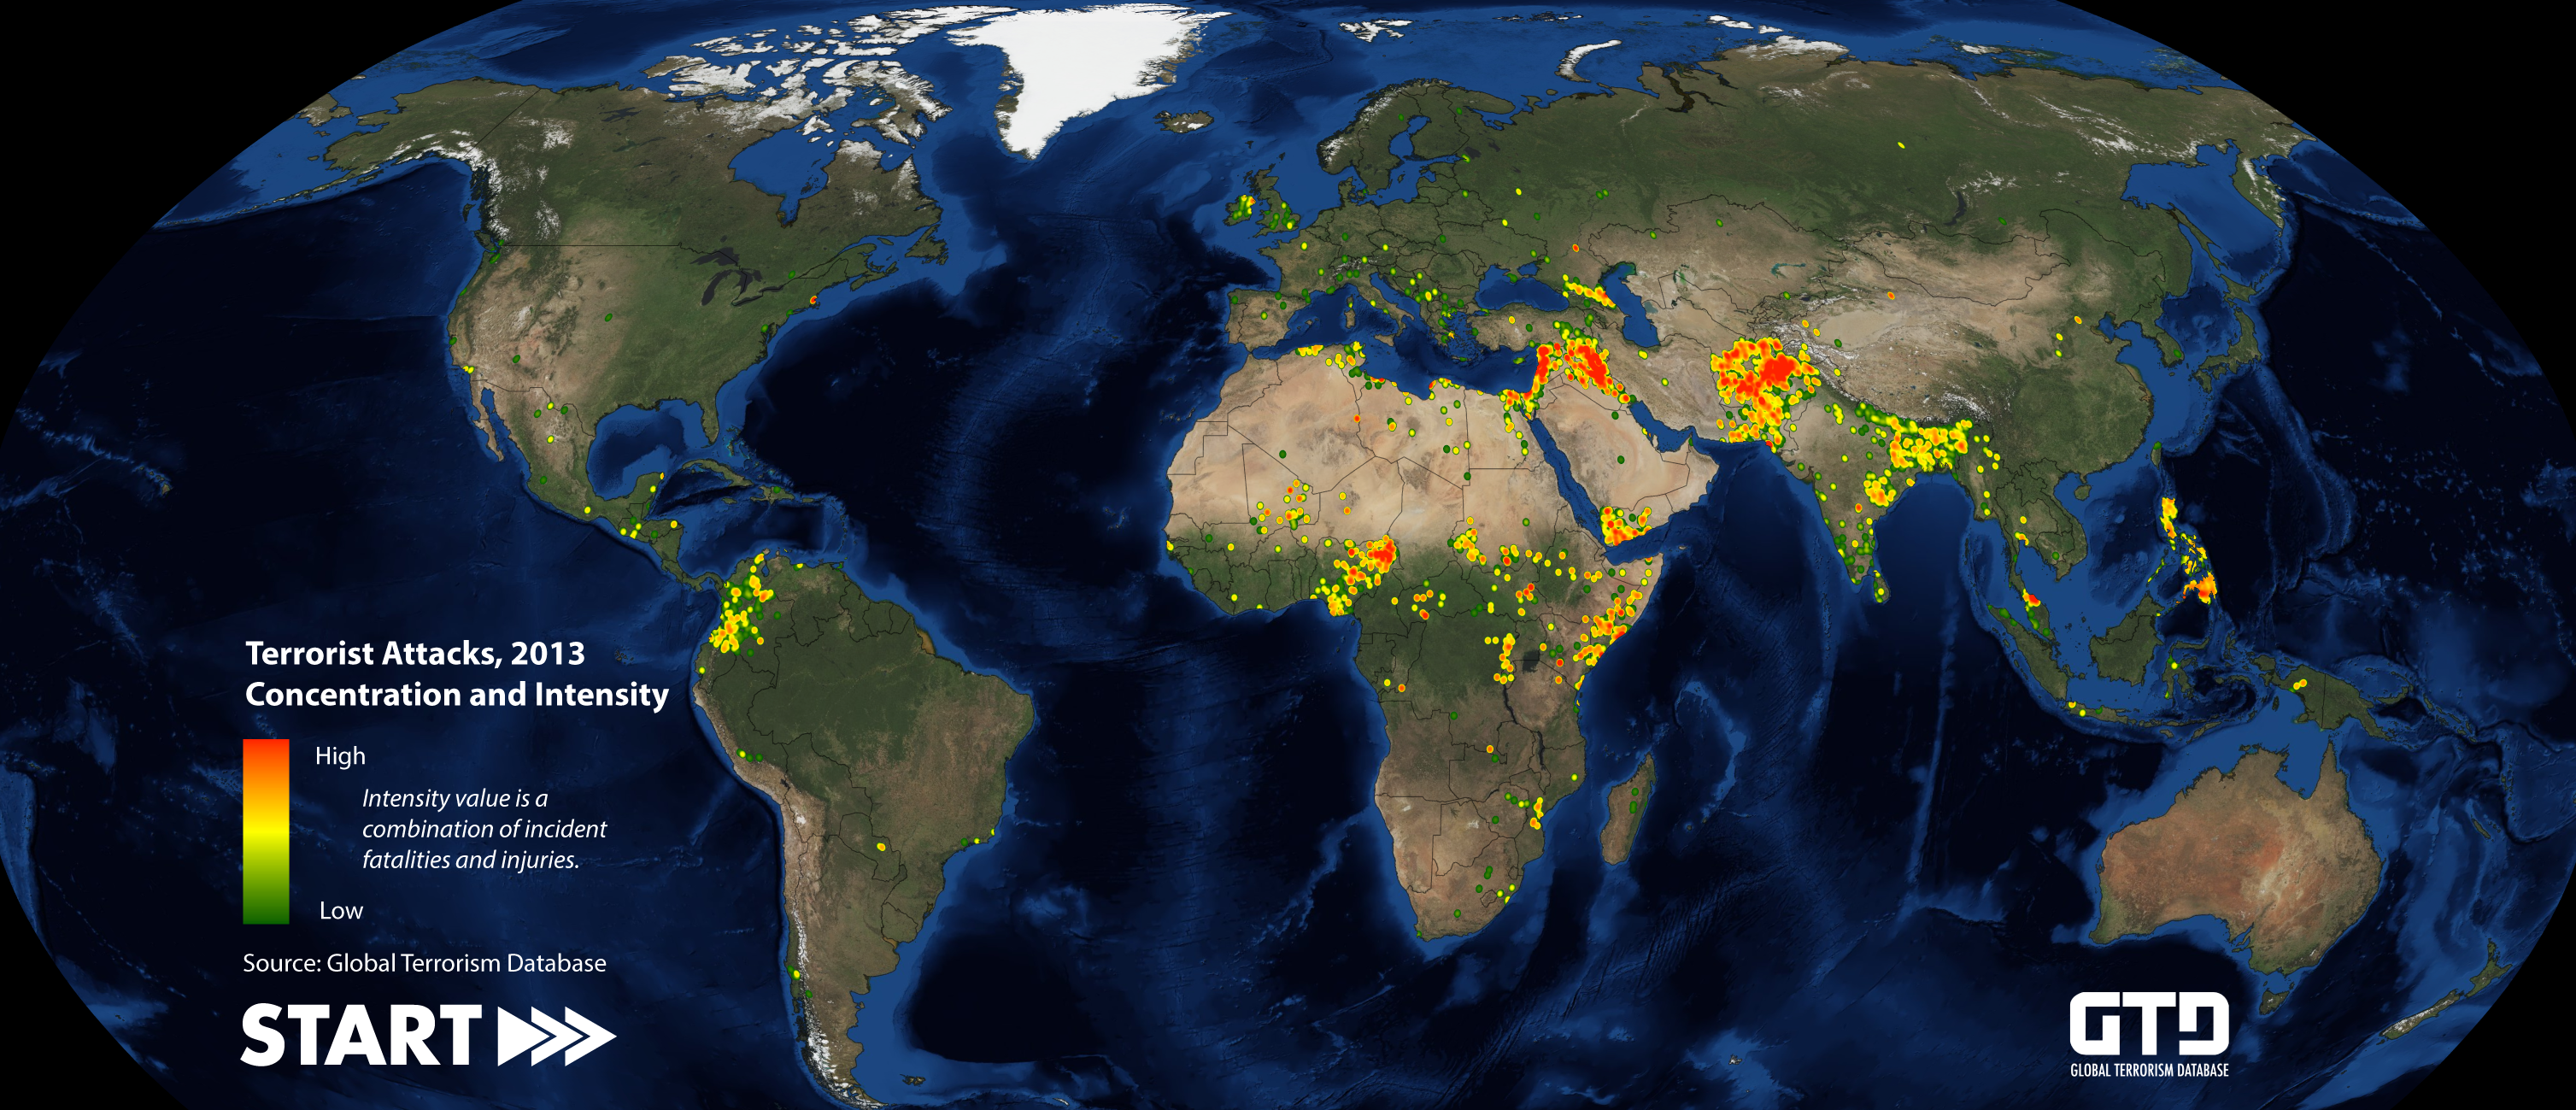
Graphic designed by William Kammerer, START.
**Note: This graphic is based on preliminary data that is subject to change. 2013 GTD data is not yet available for public download or distribution. It will be released via the GTD website later this summer.
Photo credit: Anne Knight (adapted by War on the Rocks)


“Terrorism’s footprint is truly global.” I see blobs over places Islamic insurgencies or other separatist conflicts only. Am I missing a ‘global’ aspect? Those can mostly be attributed to local political issues from a combination of religious fanaticism, political and economic disenfranchisement, and government corruption.
I agree with Jeremy’s statements. The infographic depicts the location and frequency of employed terrorism tactics, but gives no understanding of the groups or motivations behind the attacks. As I have just completed START’s Certificate in Terrorism Analysis program, this generalization concerns me because the graph does not differentiate al-Qaeda from the Animal Liberation Front. Nor does it separate global jihadi terrorism from lone-wolf attacks against local governments. I’m sure future graphics will cover this issue.
James: The infographic doesn’t show frequency, it shows intensity as defined solely as number of deaths and fatalities. So a single event in Boston shows as red. That’s the problem I have with this graphic.
Jeremy: I described the pattern of terrorist incidents as “global” but not “uniformly global.” These incidents occurred in nearly half of the world’s countries, which make it an extremely widespread security challenge. And you’re certainly right about the highly localized nature of the ideological motivations and specific grievances that underwrite acts of terrorism.
James: Each of the coming infographic sets will indeed dive into the more detailed nuances that a global picture such as that depicted in the heat map can’t necessarily capture.
Thanks both for reading, and hope you come back to see the further installments we’ll publish in this series!
What an amazing inforgraphic. So much information translated in one view. Must have taken a lot of effort to distill all that information onto one map.