Join War on the Rocks and gain access to content trusted by policymakers, military leaders, and strategic thinkers worldwide.

This week, the Biden administration released its proposed defense budget for fiscal year 2023. What should we make of it? We have a powerful resource to help us understand that question: Last year, the American Enterprise Institute, Center for Strategic and International Studies, and War on the Rocks jointly released the Defense Futures Simulator. Our goal was to make defense budget decisions more accessible, transparent, and engaging. After tens of thousands of simulations, we have been able to glean some initial insights into how a subset of national security experts think about defense budget decisions.
This analysis is drawn from a sample of roughly 1,000 simulations run in mid-2021. The simulator does not collect data on user identities, but we expect that users are more educated and focused on defense issues than the average American. Therefore, this should not be seen as a representative sample of the American people, but rather a subset of defense experts in the United States and beyond. Inputs may not reflect individuals’ actual preferences since users could simply be testing the software or examining alternative strategies. Nonetheless, our initial assessment of these inputs yields some intriguing results.
More Resources for Chinese and Russian Challenges
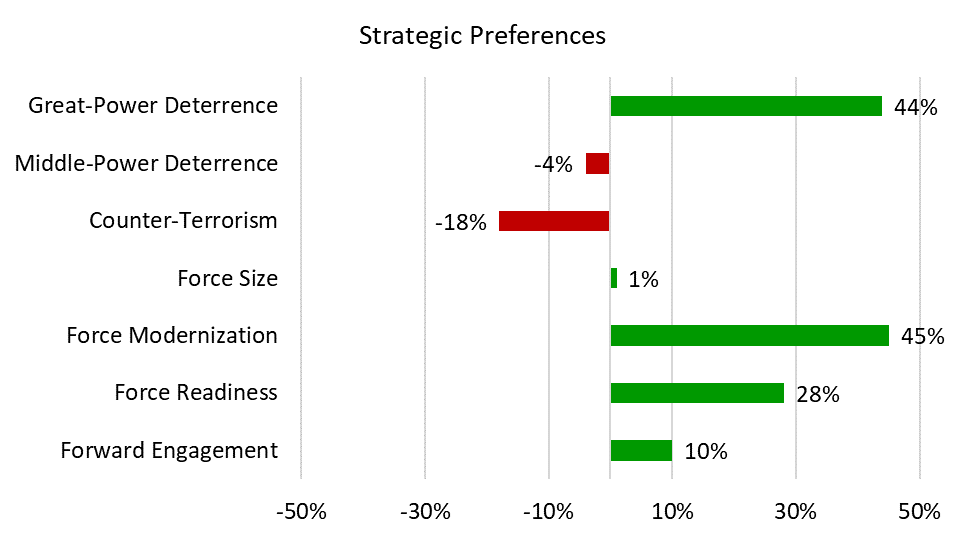
Users input two types of preferences into the simulator: strategic preferences and budget preferences. Strategic preferences are divided among three types of missions (great-power deterrence and defense, middle-power deterrence and defense, and counter-terrorism/counter-insurgency operations) and four force compositions (size, modernization, readiness, and forward engagement). Users are asked whether they want to increase or decrease emphasis on each of these missions and compositions as compared to the current strategy and force-structure baseline.
Overall, the users of the simulator have a clear desire for more focus on great-power deterrence and defense over either middle-power deterrence and defense or counter-terrorism and counter-insurgency operations. These preferences equate to a greater focus on China and Russia, which is logical given the recent U.S. withdrawal from Afghanistan and ongoing concerns about crisis scenarios involving Taiwan and Ukraine. This may also reflect user beliefs that the United States is overly focused on threats from Iran and North Korea.
To best accomplish these missions, users explored some major changes in the composition of U.S. forces, which may surprise observers. Rather than seeking a larger military as is often suggested, users mainly seek to modernize U.S. forces by investing in new technologies and fielding more advanced systems. Users also support investments in force readiness, designed to increase the capability of the force in the near-term. This suggests concern not only with the future threats from great-power competitors, but also addressing near-term challenges as well. A small increase in forward presence is also preferred among users.
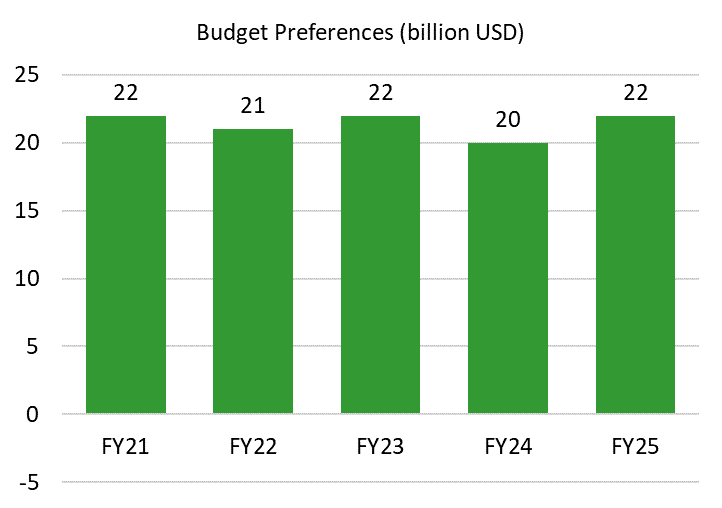
Finally, users suggested increases in defense spending of roughly $22 billion per year, on average, over the next five years compared to the Biden administration’s FY22 request, the current request at the time of these results. Users moved funding levels for the Department of Defense much closer to the $742 billion enacted for FY22 and the $773 billion requested for FY23. These results suggest that the average Defense Futures Simulator user follows the defense debate fairly closely, or at least that the group as a whole explored changes to the budget that increased spending much closer to the coming reality.
1,000 Simulations, Six Groupings
Based on a careful analysis of user choices, it is possible to look not just at average preferences explored in the simulations, but also to identify six distinct groups of simulations with similar preferences.
 Big Spenders (24 Percent )
Roughly a quarter of the simulations run during the period of analysis increased the defense budget by more than $250 billion over the next five years. We term these users “big spenders” because many of them sought to increase defense missions and composition across the board, with a major increase in great-power deterrence (70 percent) accompanied by a small increase in middle-power deterrence (10 percent) and a small decrease in counter-terrorism activities (-10 percent), on average. They were the only group to endorse increases in force size also preferred more force modernization, readiness, and forward engagement.
Big Cutters (10 Percent)
Conversely, one in 10 simulations decreased the budget by more than $250 billion over the next five years. These “big cutters” were the only group to cut forward engagement, and they cut force size far more than other groups, while maintaining funds for modernization and readiness. Interestingly, however, this group did not tend to decrease all of the military’s missions, instead increasing emphasis on great-power deterrence by 10 percent, while decreasing middle-power deterrence by -30 percent, and counter-terrorism/counter-insurgency operations by -40 percent on average.
Great-Power Focused (42 Percent)
Over four in 10 simulations increased the emphasis on great-power deterrence and defense by at least 20 percent and placed more emphasis on this strategy than the other missions. Notably, this group tended to favor substantial increases in force modernization and force readiness, at the expense of force size, and chose to increase spending by an average of $33 billion total over five years.
Middle-Power Focused (3 Percent)
The smallest group are those focused on middle-power issues, at just one in every 30 simulations. These simulations increased the emphasis on middle-power deterrence and defense by 20 percent and placed more emphasis on this strategy than on other missions. Despite different mission priorities, this group had similar force-composition preferences to those focused on great powers. They averaged a $29 billion total increase in defense spending spread over the next five years.
Counter-Terrorism/Counter-Insurgency Focused (6 Percent)
One in every 17 simulations increased emphasis on counter-terrorism and counter-insurgency operations by at least 20 percent and placed more emphasis on this strategy than the other missions. This group tended to emphasize force modernization slightly more than force readiness. They also opted to cut force size more than any group other than the big cutters, but unlike the cutters they increased spending over the next five years by a total of $27 billion on average.
Mission Tweakers (7 Percent)
Finally, one in every 14 simulations made only minor increases or decreases to all of the missions while holding budgets relatively stable. This group tended to suggest the smallest increases in modernization, readiness, and forward engagement of everyone but the big cutters. They did, however, suggest spending an additional $19 billion on defense in the next five years.
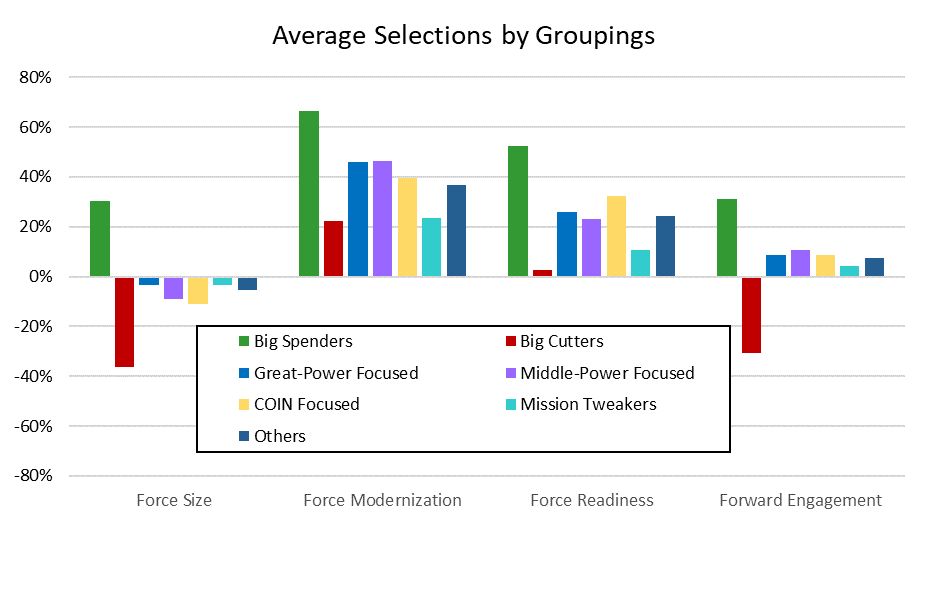
[Note: Approximately 9 percent of users do not cleanly fall into any of these categories and are shown as “other”]
Conclusion
The results analyzed in this paper are by no means comprehensive or statistically significant. Rather, it is a snapshot in time of the preferences being explored by a range of users — some of which may have run multiple simulations that are reflected in the data. The best way to interpret this data is therefore to view it as a glimpse into the ideas and shifts in strategy that national-security thinkers were exploring at the time. A wide variation of strategic preferences and specific budgetary choices across simulations highlights areas of divergent thinking. Examples of this are the difference in budget levels between the big cutters and big spenders groups and the fact that both adding and cutting Army active duty BCTs were among the most common selections made. In contrast, areas of agreement and similarities across simulations illustrate pockets of relative consensus. Examples of consensus include the fact that all of the groupings increased the preference for force modernization and readiness on average, and that accelerating the three main nuclear modernization programs were among the most common selections overall.
If making defense strategy and spending decisions by committee seems ill-advised or unrealistic, consider that each year the U.S. defense budget is crafted by at least 536 senior policy-makers: the president of the United States, 435 representatives, and 100 senators. In this sense, U.S. defense spending is a microcosm of democracy in which the crowd determines strategic priorities through its funding decisions. However, the average American and many policy-makers do not have the expertise or information necessary to directly engage with defense strategy and the defense budget. These results from the Defense Futures Simulator can therefore provide an important instrument for understanding how strategy and budget connections are made and bridging this information divide.
The simulator is a publicly available resource that will help to elevate national security-related strategic and budgetary decisions for many years to come. With the FY23 budget request comes the chance for the realignment of funds in agreement with important strategic aims. As soon as the necessary budget documents are released, the Defense Futures Simulator team will get to work updating almost 10,000 points of data within the simulator’s vast data set to provide users with access to the most up-to-date numbers and shift the years available for manipulation one year into the future. As defense strategy and budget levels ebb and flow, the Defense Futures Simulator will continue to put these vital concepts and details within reach of students, policymakers, and other experts alike.
Emily Coletta is the project coordinator for the Defense Futures Simulator. She is also a research assistant at the American Enterprise Institute where she focuses on defense budgeting and strategy.
Zack Cooper is a senior fellow at the American Enterprise Institute and co-director of the Alliance for Securing Democracy. He co-hosts the Net Assessment podcast for War on the Rocks.
Image: U.S. Navy (Photo by Mass Communication Spc. 3rd Class Taylor Crenshaw)