Join War on the Rocks and gain access to content trusted by policymakers, military leaders, and strategic thinkers worldwide.

As Major League Baseball begins another season, I am once again reminded that the Air Force could learn a lot from the $36 billion industry that is America’s pastime. Just as the Air Force spends tens of millions of dollars per airplane, big league general managers spend tens of millions per player to sign a roster they believe will give them the best chance of winning. Both organizations have operating costs and work within budget constraints. Both organizations try to use clear, measurable statistics and specifications to provide an indication of how much to pay for what type of asset. However, neither baseball nor airpower has a simple calculation for how much success their investments will produce. So what does Major League Baseball do that the Air Force does not?
Made famous by the film Moneyball, baseball teams embrace several forms of predictive analytics. Simple statistics, such as batting average, give way to more complex ideas such as on-base or slugging percentage, all of which contribute to higher-mathematical equations to better evaluate past performance and predict future contributions.
In defense circles, airpower analysis remains reliant on simple indications of cost and capacity, and analysts fail to quantify the intangibles that produce wins. Maybe it is because analysts do not understand the operational variables, or maybe it is because the operators do not understand analysis. By taking a lesson from the big leagues, the Air Force could better predict the price and performance of its acquisitions against a host of adversaries.
For example, take the Air Force’s upcoming light attack demonstration: The debate has revolved around cost-effectiveness indicators such as flight hour cost and weapons payload. This is akin to looking at a baseball player’s batting average or home run totals without considering how he fits on the roster. In order to truly compare the current Air Force inventory with the cost of procuring a light attack prospect, the service needs to compare the total operating costs of each platform with the wins each platform can generate. To do this, the Air Force needs to do some higher math.
Generating “Wins”
There is an epidemic failure within the game to understand what is really happening…Your goal shouldn’t be to buy players, your goal should be to buy wins. And in order to buy wins, you need to buy runs. — Peter Brand, Moneyball (2011)
In baseball, scoring is the currency for predicting wins and comparing players. Airpower analysts have claimed statistics, such as missions and sorties flown, sorties with weapons engagements, and total weapons released, as indicators of mission success. Yet, merely flying missions ensures no more success than sending a little leaguer to the plate in a major league at bat. Likewise, counting total weapons released does not illustrate whether the team is overpaying a big league hitter for unnecessary production in a minor league game. Strategically, one may question whether defeating an adversary armed with $10,000 Toyotas or $2,100 AK-47s is worth the millions in aircraft operating costs or billions in aircraft procurement due to early service life attrition. The Air Force needs to consider how many runs it needs to buy in order to buy the wins it needs.
Fully applying the concepts of sabermetrics to airpower would require a work similar in length to the 1,024 page Bill James Historical Baseball Abstract. Based upon the Air Force’s stated light attack requirements, a basic, tangible requirement that can be analyzed in this abbreviated forum is fires. With regards to fires, scoring is best measured by the quantity of targets effectively struck.
The term target has differing connotations among varying audiences. Here it is used to describe a single enemy asset. A target destroyed by one airframe is equally as dead as the same target destroyed by another, despite differences in missions, sorties, flight hours and/or weapons used to achieve the same result. Further, the type of target assumed allows a comparison between the cost of the strike and the cost of the asset to the enemy.
In baseball, some teams are more difficult to score on than others.
Typical insurgent adversaries, if such things exist, rarely employ major weapons systems. More often, the target is personnel in defilade or unarmored vehicles. The military attempts to reduce collateral damage, especially in a counter-insurgency. This often lends to targeting assets as they move in between urban areas to reduce the chance of civilian casualties. When targets must be struck in urban areas, smaller explosive yields are preferred in order to minimize collateral effects. In identifying a relatively unshielded, mobile target with potential collateral damage concerns, aircraft armament can now be considered.
In baseball, the manager sets the lineup to best outscore that day’s opponent.
So too will aircraft be armed with the best munitions combination, or weapons loadout, the airframe can carry based on the variety of targets expected prior to the mission. Defining a potentially moving target shortens the menu of munitions and even eliminates some airframes. The weapons loads in this example were chosen to depict each airframe’s highest capacity and capability against moving targets at the lowest cost. Therefore, common loadouts used in theater may not be represented.
In baseball, the player is paid for every at bat, regardless of whether he scores or strikes out.
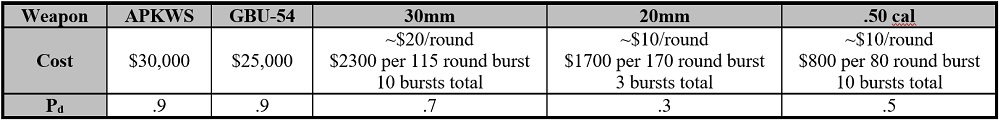
Similarly, the cost of all weapons expended must be accounted for. The precision guided munitions (PGM) selected in this case have impressive precision and maneuverability, but come with a proportionally hefty price tag. The increased reliance on PGMs increases total mission cost well beyond that of a single flight hour. Like cost per flight hour, the unit cost of many weapons is unfortunately ambiguous (see Table 1).
In baseball, only the at bats that generate scoring affect the team’s ability to win.
Similarly, only weapons that hit their targets contribute to mission success. Whether by pilot error, mechanical failure, or misfortune, not all weapons will destroy their intended targets. With targets and weapons matched, the likelihood that the weapons succeed can be determined. Akin to complex sabermetrics, such as on-base average or runs created, this calculation is commonly referred to as the probability of destruction (Pd).
Pd is simply a probability of success in achieving a specified effect. It can be expressed in many levels of destructive qualities. However, these effects quickly become classified and unavailable. Several smaller weapons against a single target may increase Pd and drive the cost per airstrike higher. Conversely, a single, large weapon may be able to service more than one target in some situations and drive costs lower. Both cases complicate this metric and provide opposite effects on the cost per airstrike.
Given the assumed target characteristics, consider Pd the probability of a single weapon or gun burst successfully striking a single target. The surrogate, unclassified Pd estimates in this demonstration are listed in the first table below on weapons considerations. The Advanced Precision Kill Weapons System (APKWS) and GBU-54 were assigned a Pd based upon open sources (Air Force fact sheets, GlobalSecurity.org, news sources, and public industry fact sheets). Gun system effects were estimated from this benchmark based upon caliber, mounting, and airframe speed. The three in combination with low altitude employment have proven critical to documented successes.
You won the exact same number of games that the Yankees won, but the Yankees spent one point four million per win and you paid two hundred and sixty thousand. — John Henry, Moneyball (2011)
Remembering that this analysis is focused on counterinsurgency fires, it is worth noting that the price tag is as important as the Pd. As mentioned, the goal is to win the game on a budget by reaching base and scoring consistently, not to set meaningless statistical records while losing. Although PGMs offer a homerun capability, they come at a price, just like the Yankees roster. Assuming both teams win the same number of games, it is better to field a fiscally conservative roster with consistent scorers a la the Oakland A’s — a roster just good enough to consistently beat the average adversary season after season. Given the protracted nature of counterinsurgency, the A’s roster is the niche light attack needs to address so that the Air Force can save its Yankees payroll for a real World Series match-up.
Total Mission Cost
Where on the field is the dollar I’m paying for soda? – David Justice
It’s hard to see exactly, but… — Peter Brand, Moneyball (2011)
Operating costs for a baseball franchise span from marketing to stadium maintenance costs to the cost of player contracts and beyond. Accurately encompassing the vast variety and fluctuation of these costs quickly becomes overwhelming. It is just as easy to get lost in calculating aircraft operating costs. Many variables affect the cost of a flight hour even without considering hidden costs such as basing requirements and aerial refueling. In order to prevent this article from becoming a dissertation, some scoping assumptions need to be made.
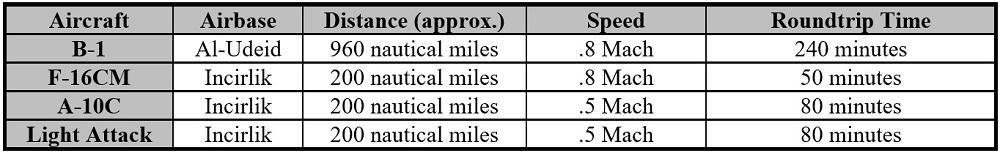
The selected basing and target locations allow aircraft to operate within their combat radius to eliminate aerial refueling costs. The fuel required to perform the mission is considered regardless of refueling method, so it is just the cost of delivering the fuel via tanker that is missing. However, tankers are operational-level assets, and calculating the cost of tanker operations requires analyzing the operation in its entirety. This would require additional conjecture on the planning and execution of the air refueling operation, and in some ways, leave more questions than answers. Although current operations in Iraq may not reflect this assumption due to Status of Forces Agreements and/or operational risk acceptance, the selected base and target locations in Table 2 are nonetheless realistic.
Additionally, the forward basing of attack aircraft, either on dirt, austere, or existing runways, has been intentionally omitted. Whereas these forward locations are inaccessible to typical fighter and bomber aircraft, both the A-10C and light attack candidate have the ability to operate from austere bases with limited supplies, potentially planning in person with their ground counterparts. These forward locations can shorten transit and increase loiter times, but it is difficult to gauge how much closer that location could be. Terrain suitability, security, sustainment, and the commander’s risk acceptance are just a few of the many considerations. Still, austere operations do offer the ability to evaluate reduced weapons payloads sustainable from tactical airlift platforms. For these reasons, forward operations will be used to explore cost-effective weapons loads, useable from established or austere locations, but not to affect transit or loiter times.
This leaves the total mission cost described as a derivative of two components — flight time and weapons cost. Weapons cost was already covered, but flight time varies greatly based upon mission requirements. Therefore, flight time is broken down into transit time and loiter time to clearly establish assumptions.
Although this scoping will leave the analysis incomplete, these assumptions are conservative and favorable to the current Air Force inventory. Should the current inventory prove more cost-effective, these assumptions will require reconsideration. Conversely, if the light attack prospect performs favorably, it will undoubtedly be the more economical fires solution.
A mission’s transit time is dependent on the aircraft’s point of origin and destination.
Although bomber aircraft can strike globally, contemporary operations suggest regional operating locations are most likely. Fighter and attack aircraft can stage locally but generally operate from developed airbases with prepared surfaces due to foreign object damage potential and aircraft logistical requirements. Assuming a target in central Syria, transit time considerations are listed in the next table, on aircraft transit assumptions.
The loiter requirement of every real-world mission varies.
The cost of a mission grows with increased sortie duration. In order to prevent artificially inflating the relatively high flight hour costs of the current Air Force inventory, the loiter time used in this demonstration is limited to 30 minutes to show a best-case scenario. It is realistic that an aircraft with only two munitions could spend most of this time searching for just two targets, or awaiting a suitable collateral damage situation for employment. On the other hand, for aircraft with high weapons capacity, 30 minutes may not be enough time to tactically employ all the weapons in accordance with the stated assumptions. This again provides a best-case scenario in favor of the current U.S. Air Force inventory.
Cost Per Airstrike
It’s about getting things down to one number. Using the stats the way we read them, we’ll find value in players that no one else can see. — Peter Brand, Moneyball (2011)
Having stated the assumptions, the formula below can be used to highlight several interesting trends in cost per airstrike and targets destroyed:

In order to set a baseline, consider each airframe with its maximum loadout of GBU-54s.
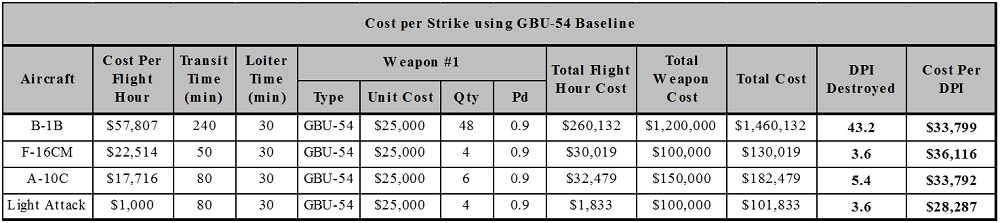
When advocates promote a bomber as the platform of choice, they note the relatively low cost per airstrike because they assume the air component conducts business in bulk. This is analogous to looking at ballplayers based only upon their ability to hit homeruns. The large quantity of targets destroyed masks the power hitting B-1B’s large total flight hour cost when compared to the other airframes. When total flight hour costs are only a fraction of total cost, as they are in the above example, the cost per airstrike regresses towards the weapon’s unit cost.
By incorporating the gun load of each aircraft, target cost normalizes along cost per flight hour.

This relatively small increase in targets destroyed generates exponential savings due to the gun’s low unit cost. It is similar to adding a cheaper, situationally-useful player to the bench in order to increase effectiveness in specific opportunities. It is still worthy to note the reduction in targets destroyed between bomber aircraft and fighter/attack aircraft. Overall production is still low by comparison. Conducting the additional missions, sorties, and flight hours to achieve this capacity can negate the economy achieved by lower cost platforms. If viewed in the strategic context, a bomber could be considered a cost-effective solution for limited global strike actions (i.e., not every day for 15 years). Although the GBU-54 could potentially match a wider variety of target types, it is arguably not the preferred weapon-target match for at least two of the platforms in this example.
To improve target capacity, platforms load the maximum quantity of lightweight PGMs.

In this example, the Advanced Precision Kill Weapon System (APKWS) enables single fighter and attack aircraft to approach or exceed the target capacity of single bomber aircraft while still coming in under the bomber price point. This parallels a manager considering several hitters with varying approaches to creating runs for his lineup. If the B-1B is the power hitter of the group, then perhaps the F-16CM hits for average, light attack has a high on-base percentage, and/or the A-10 holds a high slugging percentage.
This is to say the effects on the targets are not equivalent. The effects have been reduced from a 500-pound weapon with meters of precision to a 5-pound warhead striking within inches. However, both can be effective on the assumed target in this demonstration, as well as a variety of armored targets. Nor is it to say that stockpiles, logistical trains, or manufacturers’ production rate could meet the consumption capacity demonstrated in this chart. In this maximum PGM configuration, attack aircraft are often viewed as slower, less defendable versions of their fighter counterparts due to similar costs (albeit versions with increased weapons capacity).
Smaller loads of lightweight PGMs can balance target capacity with cost-efficiency.

Sustainable in austere locations by tactical airlift, this smaller loadout of rockets and guns allows attack platforms to standout with relatively high target capacity and strike costs below $20,000. Just as general managers do not field a team to only hit homeruns, counterinsurgency is not about destroying targets in bulk. The goal here is to find efficiency by lowering production to match demand. The roster needs to consistently provide just enough firepower on the cheap and never be caught lacking.
Both attack platforms begin to separate themselves from the pack in this example. Surprisingly, even at 18-times the cost per flight hour of a light attack candidate, the A-10C’s has a similar cost per airstrike. The reason is the increased effectiveness of the A-10C’s gun system.
Armed with only guns, the true cost performance of a light attack aircraft shines.

An effective gun system for engaging moving targets from a fixed-wing aircraft displays the distinct cost advantage of combining low cost armament with low flight hour costs. When it comes to counterinsurgency, the game is about hitting singles and being prepared to hit them whenever necessary. For the first time in looking at these airstrike costs, the Air Force can actually afford to destroy the adversary’s $10,000 Toyota or $2,100 AK-47 for an extended duration.
This reveals an unmistakable truth of fires in the counter-insurgency environment: The best way to handle insurgent adversaries is with an overwhelming, direct-fire weapon system, preferably shoulder fired, from the ground. Not only is it cost-effective, but it has a much better chance of winning the hearts and minds of a population than striking remotely with PGMs. In a case where the nation chooses to provide these overwhelming fires from an aircraft for years at a time, it ought to be from a light platform at the minimum possible operating cost. Nevertheless, fires are not the bulk of air support in a counterinsurgency fight.
Applying the historical 7 percent strike rate to each aircraft’s cost, the results are astonishing.

It is worthy to note that this 7 percent employment rate is based on archival data from Operation Enduring Freedom. Other archives, such as flight hour data and mission reports, could easily paint a more accurate picture of over 15 years of operations. Differences in aircraft employment rate, weapon selection, and sortie duration will produce significantly more stratified results and detail the true cost of successful airstrikes in a counterinsurgency. Just as sabermetrics allows analysts to dissect the past and forecast the future, statisticians with the proper clearance could have a field day with the available data. Such a study would be of great utility to the Air Force.
Conclusions
Aside from observing each platform’s strengths in various cases, several conclusions emerge.
This analysis is merely the tip of the iceberg when it comes to forecasting airpower capacity and cost. The hypotheticals pursued here obviate that air operations for the sole purpose of airborne fires in a counterinsurgency are a poor economic exchange. However, the actual data exists. The Air Force needs to gather its own sabermetricians to review Operation Enduring Freedom to identify the most-effective, least-costly, currently-owned platforms and weapons before investing in a new aircraft.
Second, if aircraft procurement is the desired course of action, light attack is the most cost-effective platform. Even with the assumptions made firmly in the current inventory’s favor, light attack emerged orders of magnitude cheaper, and no less effective, for a counterinsurgency fires platform. It is the only platform that can come close to matching an insurgent’s operating cost when operating under the restrictive rules of engagement and non-linear battlefields that the joint community has unfortunately come to view as close air support.
Third, if only 7 percent of air support sorties in a counterinsurgency conduct fires, any light attack option must also consider the other 93 percent of the mission. Whether light attack equipment should be funded and fielded depends equally as much on how the program is manned, trained, and organized to provide additional capability and capacity in a resource constrained environment. Given the right integration, organization, and equipment, light attack could easily find other warfighting niches in major combat operations to broaden its support base.
Fourth, although no one is worried about light attack replacing frontline fighters or bombers, it must be restated that light attack is additive. It does not have the capability, capacity, or potential to replace the A-10C, as some have suggested. As several comparisons show, the A-10C can carry a variety of ordnance at or near the strike cost of a light attack platform. Under favorable conditions, it can hit for power with lightweight PGMs and is the current roster’s best player when it comes to cost efficiency. In order to get a similar capacity and variety of PGMs, as well as the precision and production from a gun system, the airframe must be designed around the weapon(s), and that will not happen until an A-X2 concept is funded. Under the strict intention of low cost fires, the entry cost of a light attack platform would be better spent properly funding the A-10C until a suitable replacement is fielded.
It all comes back to the 93 percent solution. Done right, light attack could provide a useful platform to solve a laundry list of Air Force issues and joint challenges. Done wrong, light attack will cripple the existing attack community with budget and manpower struggles, and the Air Force will sunset more capable airframes in return for one with that brand-new aircraft smell.
Maj. Joel Bier is a former U.S. Air Force Weapons School Instructor Pilot with over 1,700 hours in the A-10. He served as the Weapons School’s Chief of Academics and currently serves as an instructor at the U.S. Army’s Command and General Staff College. The views expressed in this article are those of the author and do not represent the official policy or position of the U.S. Air Force, the U.S. Air Force Weapons School, the U.S. Army, the U.S. Army Command and General Staff College, the Department of Defense, or any part of the U.S. government.
Notes from the Author
The assumptions and constraints of this demonstration are debatable. However, it is the methodology that is paramount. I have made an honest attempt to scope the accountable costs, provide a “best-case” deduction for each platform, and succinctly point out its costs and benefits. I have asked War on the Rocks to allow you all access to the spreadsheet used for the data in this article so that those concerned can download it, manipulate it, create a solution, and discuss it. I look forward to discussing what is ideal, what is possible, and what is best for our nation and its air force. ATTACK!!!
Image: U.S. Air Force, adapted