Clearing the Air on Transatlantic Burden-Sharing, Part III: Let’s Turn to Data

Editor’s Note: This is the third installment in a series. Please read the first and second installments: “What’s Going On Here?” and “You Gotta Give (Inputs) to Get (Outputs).”
Even with the NATO Leaders’ Meeting in Brussels behind us, questions remain as to both the nature and the drivers of allies’ burden-sharing behavior. For example, German Chancellor Angela Merkel announced, immediately following the meeting, that “the times in which we could rely fully on others – they are somewhat over;” and Canada’s foreign minister noted that “the fact that our friend and ally has come to question the very worth of its mantle of global leadership puts into sharper focus the need for the rest of us to set our own clear and sovereign course.”
In the second installment of this series, I discussed NATO’s mechanism for identifying military capability requirements and then assigning their development to specific nations. I also discussed how agreeing to the Wales Pledge guidelines for “input metrics” can actually help Allies address the collective action question inherent in the alliance: “Who is going to pay for all this?”
This third installment will look (briefly) at the extent to which this process is actually working, and in particular at the origins of burden-sharing behavior. Because there is a lot of carefully gathered and curated data in this area, we can answer practical policy questions empirically. NATO makes a significant amount of “input” data available as “an annual compendium of financial, personnel and economic data for all member countries.” This report, first published in 1963, allows us to compare “the defence effort of Alliance members based on a common definition of defence expenditure.” While only a few allies — Denmark, the Netherlands, and Norway — have chosen to make their “output metrics” available to the public, the European Defense Agency releases some relevant output figures (namely deployability and sustainability ratios), and the International Institute for Strategic Studies gathers and reports others.
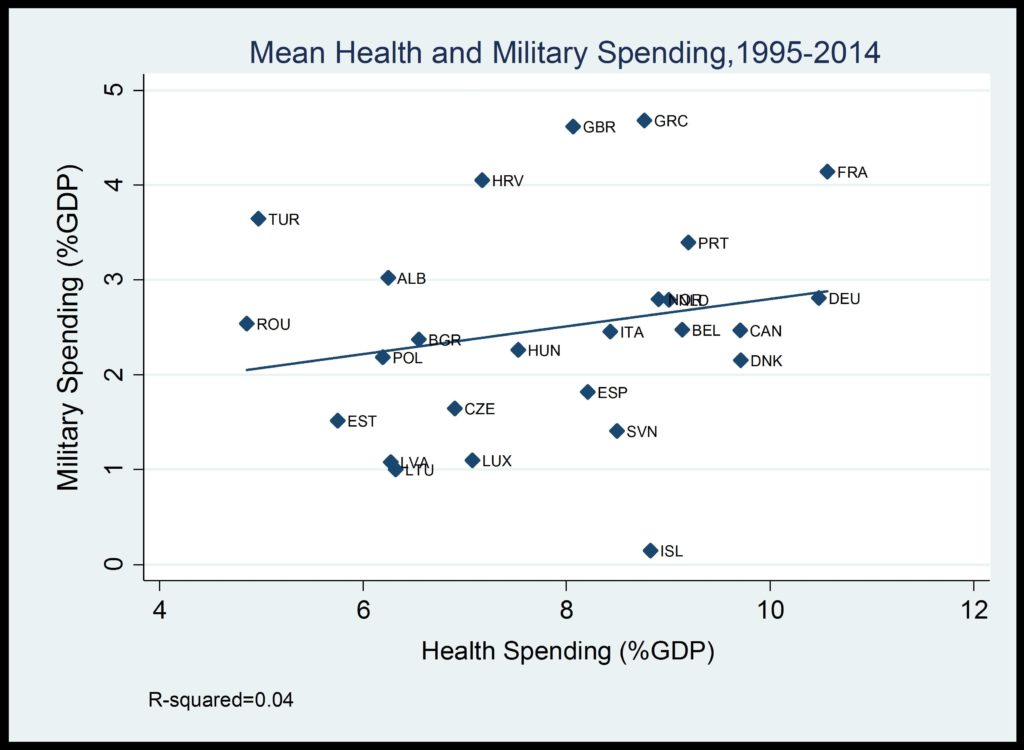
This readily available data facilitates some basic, preliminary quantitative analysis. This basic analysis leads me to make two proposals regarding oft-repeated claims about unequal transatlantic burden-sharing: First, as figure 1 below illustrates, Europeans don’t spend less on defense because, as Doug Bandow claims, they are lazy, pampered, or don’t work enough. Second, as figure 2 below illustrates, Europeans also don’t spend less on defense because they have excessively generous welfare states, as Christopher Preble suggests.
Before we get into the figures, a quick review of how to read a scatter plot is in order. By convention, the phenomena we are interested in — in figures 1 and 2, defense spending; in figures 3 and 4, deployability and sustainability — are plotted on the vertical or y-axis. The thing we think is causing the phenomenon of interest is plotted on the horizontal or x-axis. If the phenomenon on the x-axis is in fact causing the phenomenon on the y-axis, we would expect a positive relationship between observations of each – so a fitted line that captures the dots moving from lower left to upper right. The existence of such a relationship does not mean that x is causing y (correlation is not causality), but where there is no correlation, there is almost certainly no causality.
So, for example, in figure 1, if laziness (as measured by hours worked) were a cause of lower defense spending among Europeans, we would expect a positive relationship between annual hours worked and defense spending as a share of GDP. As you can see in figure 1, such a relationship does not exist — the fitted line shows that there is even a slight negative association between hours worked and defense spending. But as the r-squared of 0.01 shows, only about 1 percent of variation in defense spending can be explained by annual hours worked. As such, laziness simply seems to have very little at all to do with defense spending.
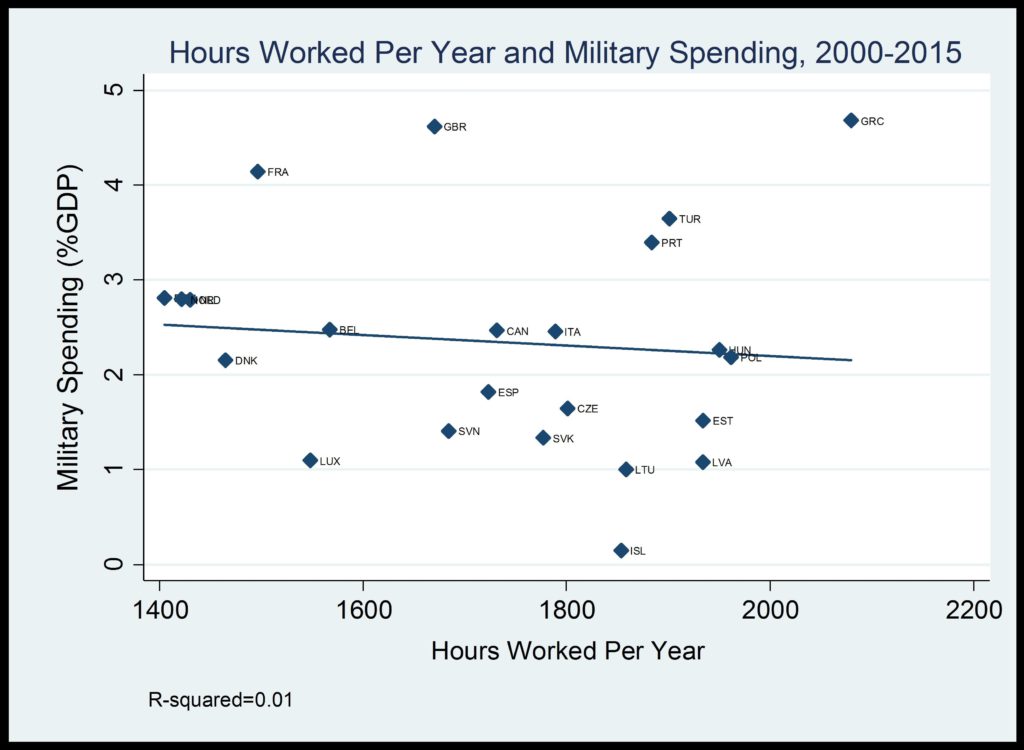
Figure 2 leads us to a similar conclusion about welfare spending and defense spending. I’ve chosen health spending as a share of GDP as one (very significant) example of welfare spending, but the results are similar for overall welfare generosity. If European allies were really spending less on defense in order to finance generous healthcare systems, we would expect the two to be negatively associated — so, we would expect the fitted line in figure 2 to slope from upper left to lower right, kind of like the one in figure 1. In fact, welfare spending and defense spending are slightly positively associated. The more a country spent on healthcare from 1995 to 2014, the more that country spent on defense. As in figure 1, the r-squared of .04 indicates that healthcare spending doesn’t really tell us much at all about defense spending: Only 4% of variation in European countries’ defense spending can be explained with variations in health spending. But again, the relationship is positive!
Based on this analysis, we should dispense with the notion that defense spending is an ethical, moral, or character issue. Europeans don’t spend less on defense because they are lazy and don’t work enough, or because they want to have nice hospitals instead of nice defense budgets.
Recalling my analogy from the last article, if I told you that the height of your would-be basketball star was on the x-axis in either of the two figures above, and a generally accepted measure of basketball players’ three-year performance was on the y-axis, I’m sure you wouldn’t draw the conclusion that his height was causing him to perform worse at basketball — at least I hope not. Claiming that light work schedules or generous health spending causes low defense spending is tantamount to drawing just such a conclusion.
Now that I’ve offered some suggestions about how not to think about the factors driving defense spending choices, let’s turn to some things that actually do seem to have an effect.
First, the empirical relationship between defense inputs and intermediate outputs is large, positive, and statistically significant. The two input metrics associated with the Wales Pledge — 2 percent of GDP on defense and 20 percent of that defense budget allocated to equipment — are powerful predictors of future military capabilities and capacity.
Think about that for a second. This means what you spend on defense items this year is directly related to how prepared you are to fight a war three years from now. That seems intuitively straightforward. But how can we test it empirically?
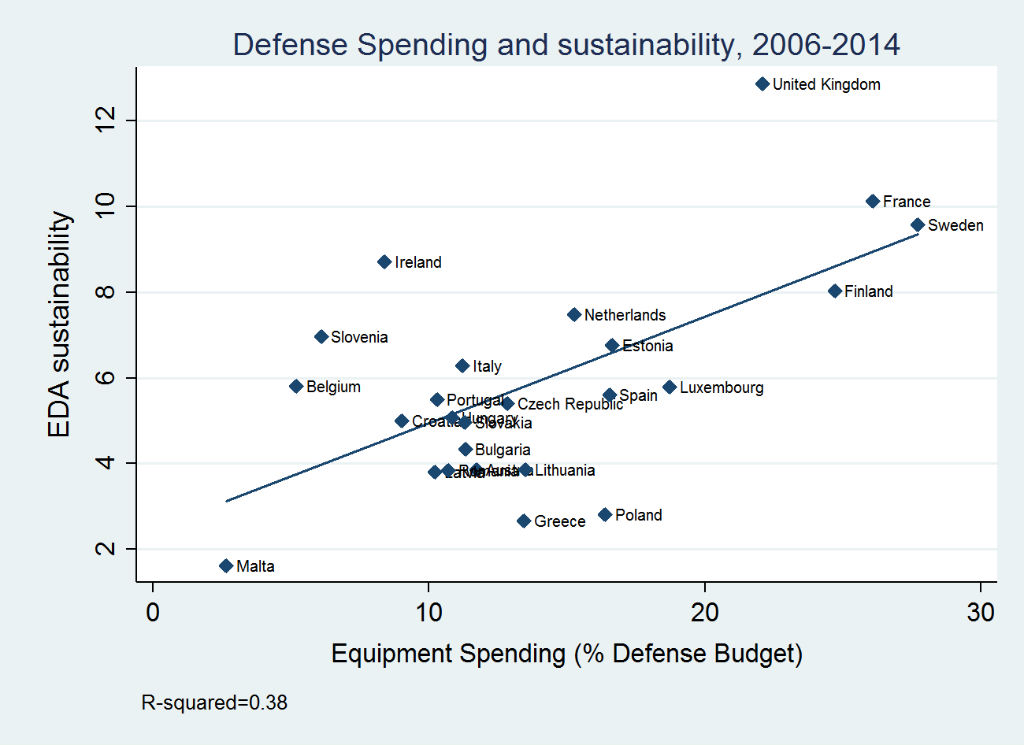
The publicly available data illustrates a powerful relationship between current defense investment and future capabilities. Investing more in defense — and in equipment, specifically — results in increased capabilities, which results in bearing an increased share of NATO’s burden in terms of actual operations. It is especially noteworthy that past equipment expenditures strongly predict present deployability and sustainability, two of NATO’s most critical output metrics.
It’s important to recognize that decisions to increase capabilities today cannot have immediate effect, but accumulate with investment over time. In other words, the equipment that countries deploy with today was purchased in previous years.
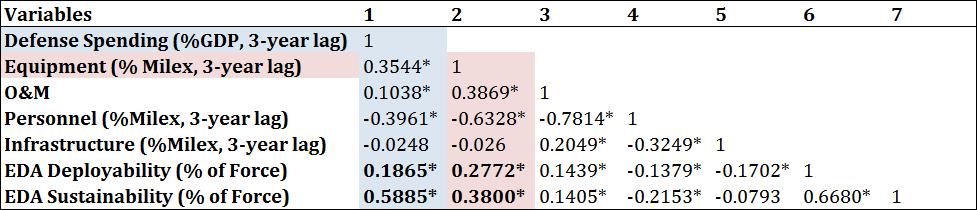
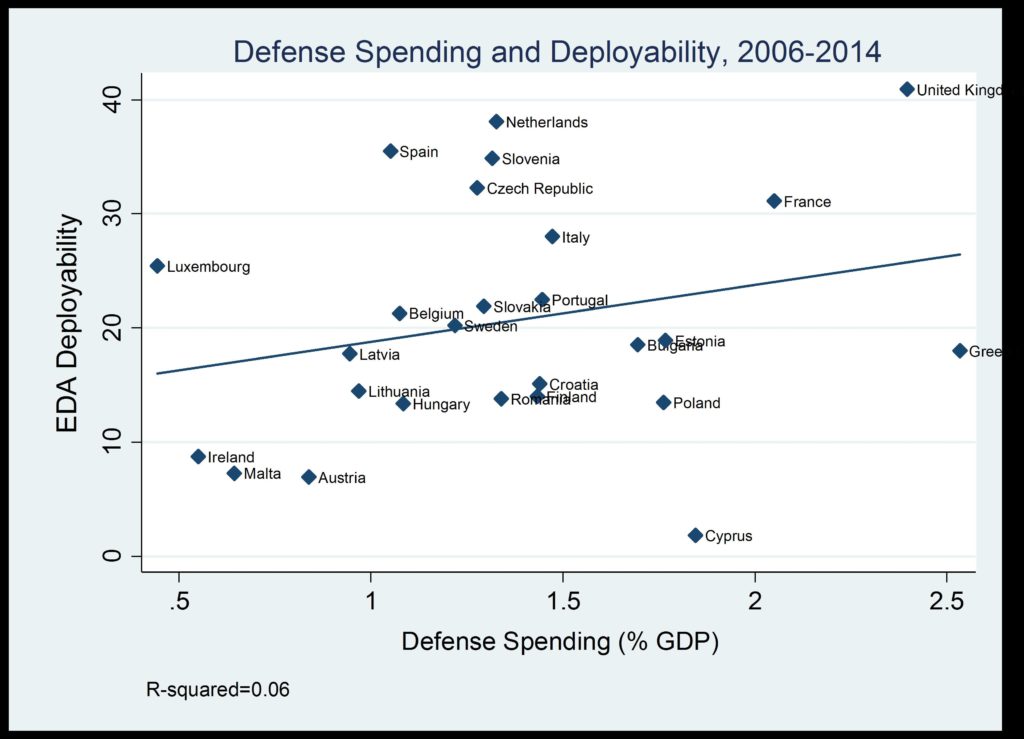
Table 1, below, illustrates the relationship between inputs three years ago and today’s outputs. Column one shows that a one percentage point increase in defense spending as a share of GDP in year y-3 correlates to a .19 percentage point increase in deployable forces as a share of total forces, and a .59 percentage point increase in sustainable forces as a share of total forces. Similarly, column two shows that a one-percentage point increase in equipment as a share of defense spending meant 0.28 points for deployability and 0.38 for sustainability. In other words, the data support the intuitive notion that inputs relate directly to outputs. Figures 3 and 4 (below) visually illustrate the most notable of these two-way relationships between important variables.
Second, what allies put in their national security plans matters. I’ve written at greater length on this subject elsewhere, but suffice it to say, more Atlanticist allies (allies preferring a transatlantic approach to European security in which the United States’ role is central, as opposed to a Europe-focused approach in which the transatlantic relationship is secondary) invest in and participate more intensively in actual operations. A less Atlanticist Europe that feels itself adrift from the United States may spend more on defense because it feels less secure, but that spending is far less likely to align with U.S. interests than if Europeans sense a strong transatlantic bond. This observation is particularly important given the remarks by allied leaders quoted above.
Third, defense spending data provides support for the notion discussed in installment two: Allies influence one another’s burden-sharing behavior through the NATO Defence Planning Process and other mechanisms of institutionalized coordination of defense planning. For example, non-ally Sweden appears to “free-ride” (measured by negative correlation between its defense spending and that of the United States) as much or more than its ally neighbor Norway.
Fourth, the strength of the transatlantic economy underwrites transatlantic security: Domestic macroeconomic conditions affect defense spending choices. Countries respond to unemployment by shifting existing defense resources to personnel, which can have a direct effect on employment, and away from equipment or other expenditures, which have only an indirect effect, if any at all. They do so even as they decrease overall defense spending. This finding suggests that as European economies improve and unemployment declines, countries may begin to spend more on equipment, in line with the Wales Pledge. I also found that countries shift resources disproportionately away from defense budgets when under fiscal stress, and particularly when undergoing the European Union’s Excessive Deficit Procedure (EDP). The EDP is designed to function as the “corrective arm” of the European Union’s Stability and Growth Pact, a set of rules designed to ensure that E.U. member states “pursue sound public finances and coordinate their fiscal policies.” In more common parlance, it is designed to enforce the “Maastricht Criteria,” or “Convergence Criteria,” whereby E.U. member states are expected to keep debt below 60 percent of GDP and deficits below 3 percent of GDP. Moreover, states undergoing EDP allocate greater resources within defense budgets to personnel, drawing them away from equipment modernization, training, readiness, and operations. In short, the Stability and Growth Pact and NATO’s pledge on defense investment may be rivals for scarce fiscal resources.
All told, the empirics align with the practical approach to narrowing the burden-sharing gap that NATO took at the Wales and Warsaw summits. However, the true effect of the Wales Pledge will not be measurable for several years, and it will be difficult to isolate its effects from the effect of tough talk on burden-sharing from Washington. Moreover, the data give us no reason to believe, from an empirical perspective, that NATO is in a particularly acute burden-sharing crisis at this moment. Taken together, the Wales Pledge and the NATO Defence Planning Process give allies the tools to both identify the capabilities they require for effective collective defense, and to allocate the necessary resources to acquire those capabilities. There’s no need for allies or analysts to malign one another or the process.
Jordan Becker is a Defense Policy Advisor at the United States Mission to NATO. This article reflects his views alone, and does not represent those of any part of the U.S. government.
Image: NATO